For this autumn we have prepared big updates for our no code data science platform. Among them new ways to work with your pipelines, simulate the behaviour, easily experiment with various data sources. Moreover, we are imploring the MLOps capabilities of Datrics, so that it takes you less time and efforts to track and manage deployments.
Pipeline deployments management
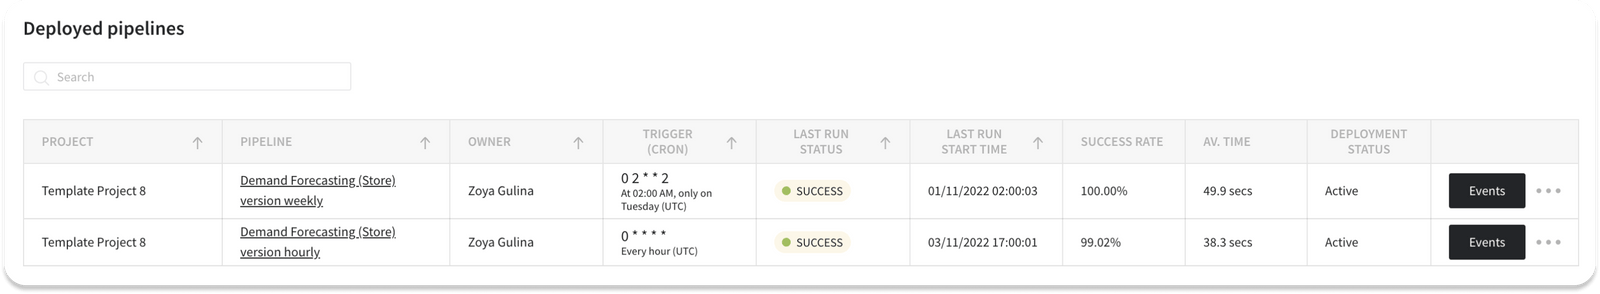
Latest update of Datrics platform simplifies the management of the deployed pipelines. We have updated the Deployment tab. Users are able to see the status and time of the last run, therefore quickly assessing the state of the deployments in the project.
There are also success metrics added to the list of the deployed pipelines - success rate and average run time. Success rate is a percent of successful runs, out of all. Average time of the pipeline run is the average time of the successful events.
In the events list of the pipeline deployment one may see the necessary information to understand the state of the deployment:
- Status of the run, error message will be shown if any
- Triggered by - Scheduled or API
- Time in UTC
- Scheduled - event added to the queue
- Started - when event was started
- Finished - time of the event end
- Time of the run

From the events page, one may manually trigger the pipeline run, the event will be added to the list.
Sometimes there’s a need to rerun the pipeline with the particular parameters. For this purpose, pipelines that were triggered by the API mat be rerun with the defined parameters from the Events page. It’s important to note, that the latest version of the pipeline will be triggered with the parameters from the previous run.
With the latest updates, when the user needs to update the pipeline before continue running the pipeline, one should not undeploy the pipeline. Now it’s possible to pause the deployment. The scene will be unblocked and available for editing.

Last but not list, the settings of the deployed pipeline (schedule, notifications) may be updated without the need to undeploy and deploy the pipeline.
Run simulations with variable mode
New variable mode adds the flexibility to the way we work with pipelines. User may create variable on the level of the pipeline and use them afterwards to the set up bricks. You may wonder when it may be useful.
Just imagine, you need to update one value in the pipeline settings and for that you have to update the 20 bricks. This definitely will prevent you to experiment with your data.
Here are some basic use cases you may consider:
- Test the algorithm with various parameters
- Change the data source without the necessity to rename all the columns and fit it to the original structure
- Create templates for other users
- Test model training for various target values
Below we sharing brief description on how to start using the variable mode.
First, you need to enable it for the pipeline. Go to the advanced settings on the pipeline scene Enable variable mode.
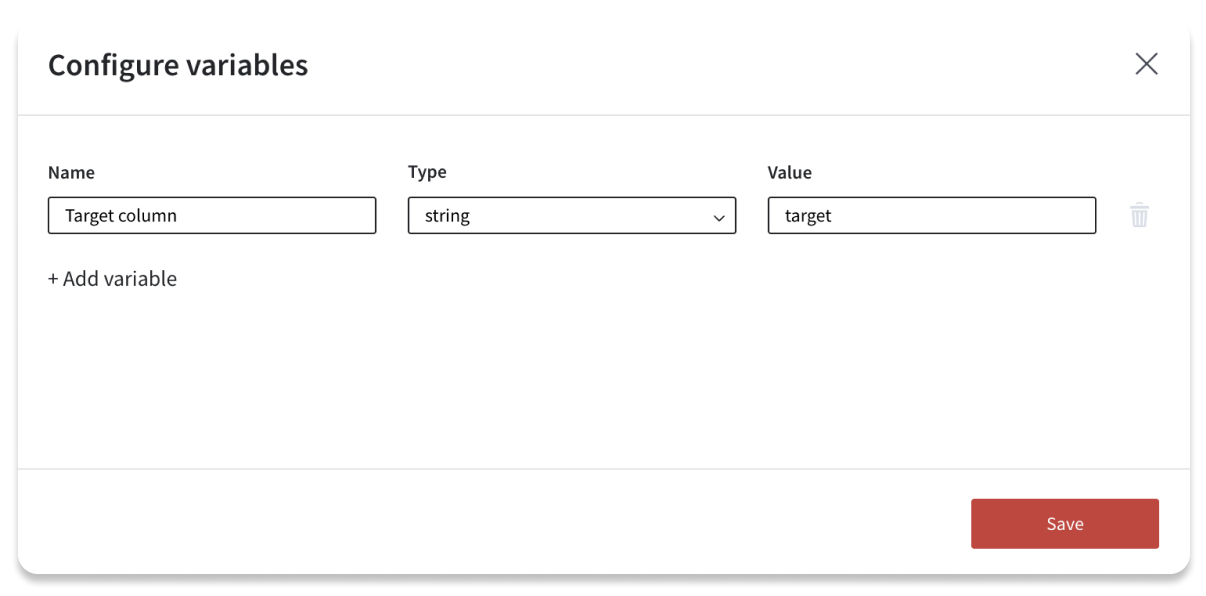
The button Configure variables will be added to your scene. Add as mane variables as you need. Set the name, type and value. This values will be further used during the pipeline runs.
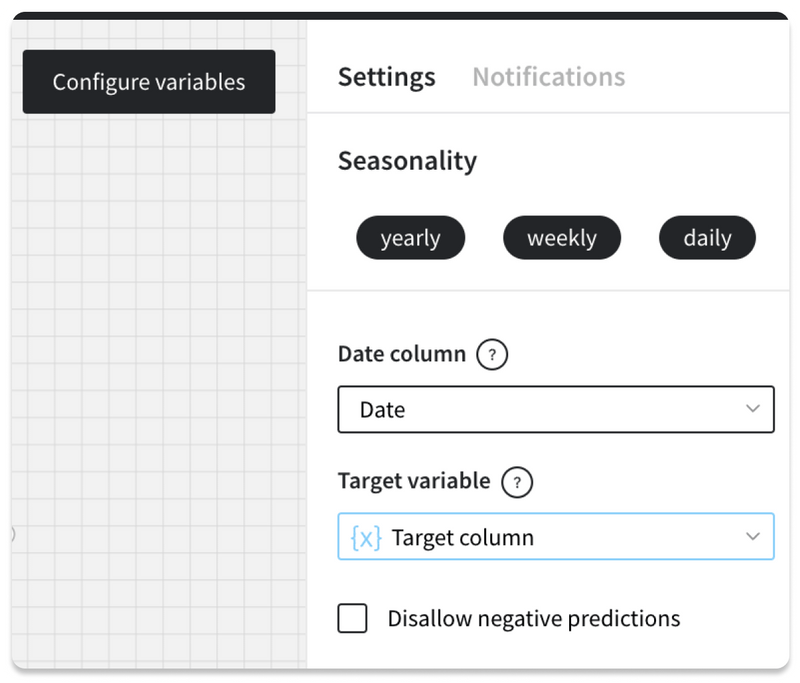
After you have created the variables for the pipeline, on the brick setting panel you will see the option to switch to variable for the settings. Not all of the settings may be switched to the variable mode, some complex bricks settings should be set up as usual, for example Bining or Math Formula bricks.
Select the variable from the list, so that value is retrieved from the variable configuration. The updated setting will be highlighted in the right panel. You may switch back at any moment by selecting switch to value in the brick settings.
Pipelines that use variable mode may be converted to pipeline bricks or deployed. Deployed pipelines will be using the latest configuration of the variables. As for the pipeline bricks, you will be able to set up variable for each pipeline brick separatelly.
We are excited with new possibilities it opens for experimentation and cooperation of the teams. Can not wait to receive your feedback.
Survival analysis
We are adding a brick with the new model to Datrics.ai - Cox Regression. Cox Regression is one of the most popular regression techniques for survival analysis, which is used to connect several risk factors or exposures, considered simultaneously, to survival time.
To train Cox regression model one needs to connect the to the input dataset and set it up. The following setting are available: duration, event, strata, cluster. The results of the model are available in the “Model performance” view.
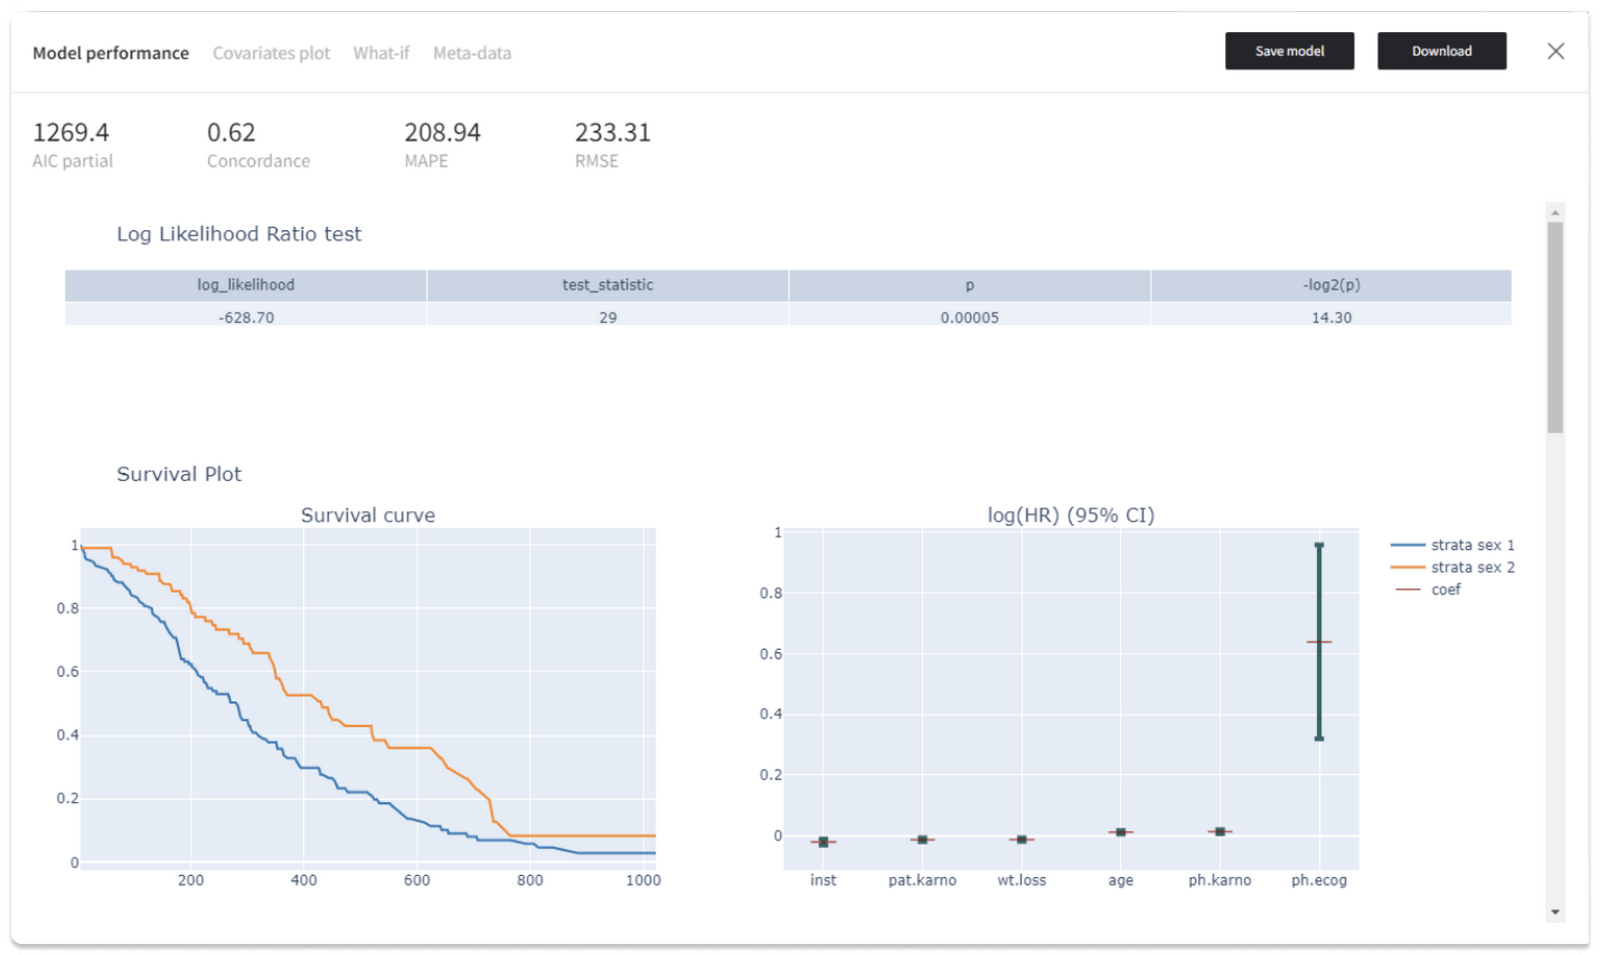
Supported metrics: AIC (Akaike Information Criterion) partial, Concordance, MAPE (Mean Absolute Percentage Error), RMSE (Root Mean Square Error).
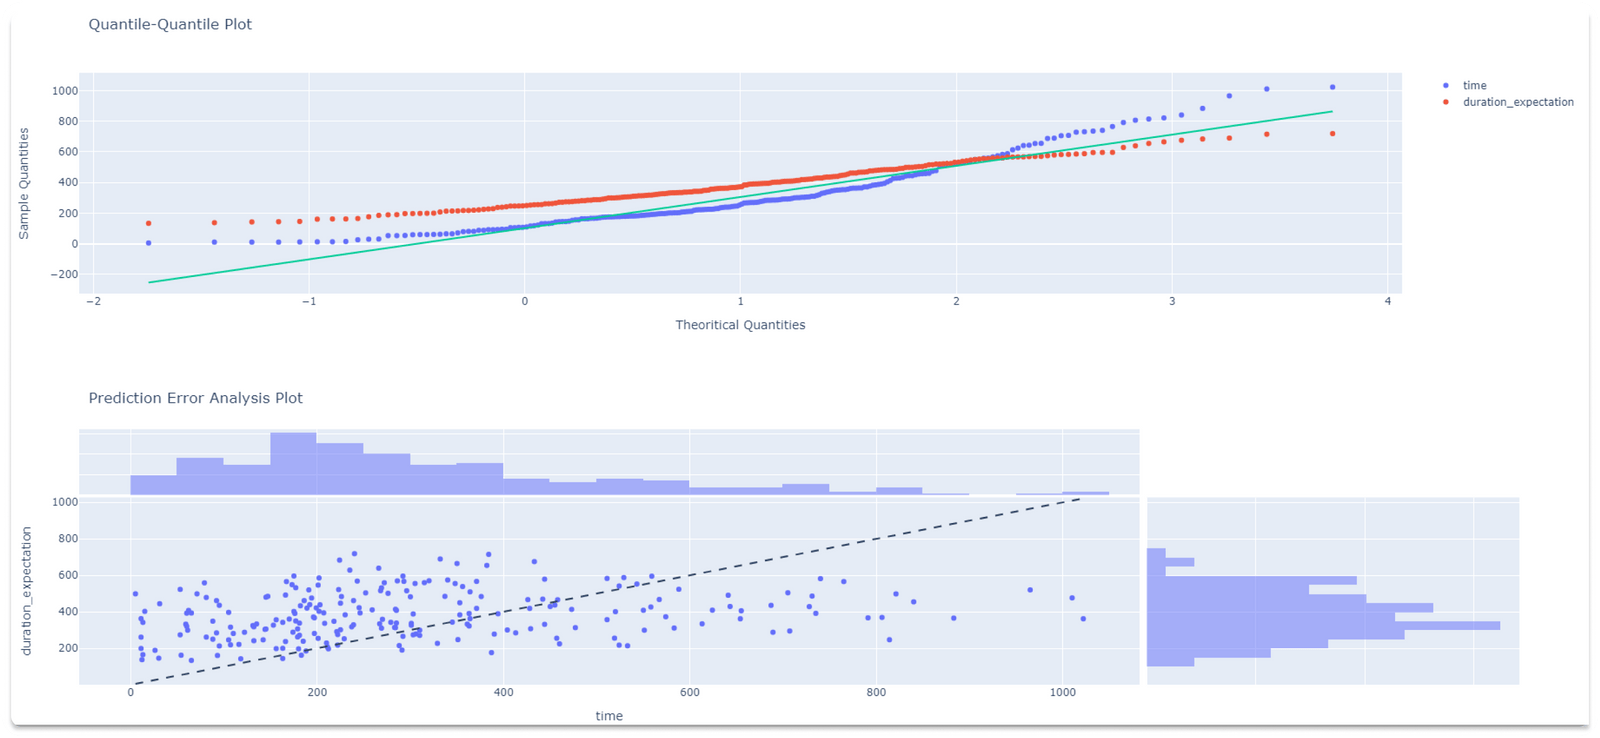
Also, we get the Log Likelihood Ratio test for the Cox regression model, where the existing model (with all the covariates) is compared to the trivial model with no covariates. If the Strata was provided, the Survival Plot shows the Survival curve and a visual representation of the coefficients (i.e. log hazard ratios) by strata. Similarly, the Hazard Plot represents the Baseline Hazard and the Baseline Cumulative Hazard by strata.In addition, the “Model performance” visualizations include the Quantile-Quantile plot and the Prediction Error Analysis plot.
Similar to the other models, Cox regression could be used for predictions in “Predict” brick and saved to the assets.
Read more on Cox regression and usage example.
Aggregate brick with new functions
Datrics constantly improves the standard bricks and covers the gaps where we find them. Therefore, we are adding new functions to the Aggregate brick:
- Median
- Percentiles
- Mode
- Count Distinct


